A website traffic drop usually comes from one of eight causes: broken tracking, seasonality, lost rankings on specific pages, a manual action or hack, a technical fault, a Google algorithm update, a changed results page, or a competitor. Check them in that order, from the cheapest check to the most expensive, and stop when the evidence points somewhere.
This post walks through that order the way I run it in audits: what each check costs, where to look in Google Search Console and GA4, and what the result tells you. One rule holds across all eight steps: change nothing on the site until you know the cause. A panicked redesign destroys the evidence you need to find it.
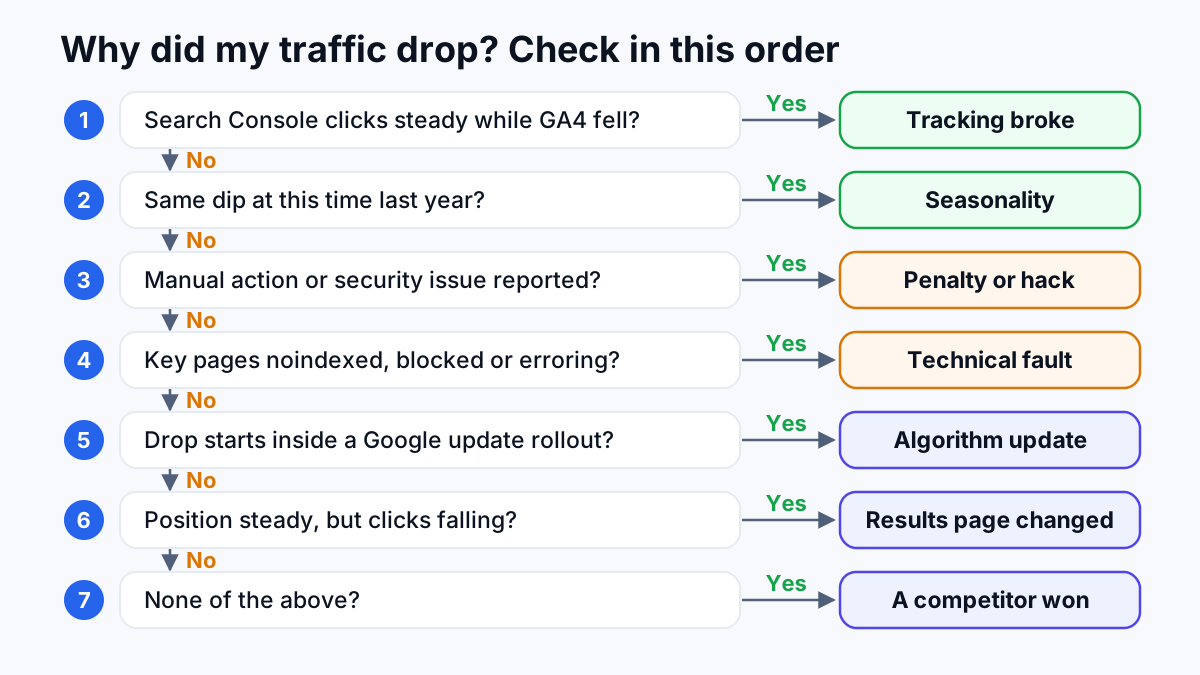
Why did my website traffic drop? Eight causes in check order
Here is the whole sequence on one screen. The order runs from cheap to expensive, and an early answer ends the investigation. Manual actions take minutes to check but come fourth, because step 3 tells you whether you're even looking at the sudden, site-wide collapse a penalty produces.
| Step | Cause | Where to check | Effort |
|---|---|---|---|
| 1 | Tracking broke | GA4 against Search Console clicks, tag and consent setup | Minutes |
| 2 | Seasonality | Search Console, last 3 months year over year | Minutes |
| 3 | Lost rankings on specific pages | Search Console Performance report, by page and query | An hour |
| 4 | Manual action or security issue | Search Console, Security and Manual Actions | Minutes |
| 5 | Technical fault | Pages report, URL Inspection, crawl stats | Hours to a day |
| 6 | Algorithm update | Drop date against Google's ranking update history | An hour, then weeks of watching |
| 7 | Results page changed | The live results page for your lost queries | An hour |
| 8 | Competitors | Who ranks now, and what their page does better | Days |
Step 1: Rule out broken tracking
Before blaming Google, confirm the traffic actually fell. GA4 (Google Analytics 4, the tool that counts sessions on your site) only sees people whose browser runs its tag. Search Console counts clicks from Google's side, so it doesn't care whether your tag fired. If Search Console clicks held steady over the same dates while GA4 organic sessions fell, the traffic didn't drop. The measurement did.
Tracking tends to break in one of four ways:
- The tag went missing. A theme update, a new page builder or a site rebuild dropped the GA4 snippet or the Google Tag Manager container from some or all templates.
- A consent banner started blocking it. A new cookie banner, or a change to its settings, stops the tag firing until someone clicks accept. People who ignore the banner stop being counted.
- A filter or property changed. An internal traffic filter with the wrong IP range, a data filter switched from testing to active, or reports still pointing at an old property after someone set up a new one.
- Channel labels shifted. Organic sessions start showing up as direct or referral, often after a redirect or a booking tool on another domain strips the referrer.
To check, open GA4's Realtime report and load your own site in a private window. If you don't appear, the tag isn't firing. Then line the drop date up against your change log: plugin updates, a new banner, a Tag Manager publish. Tracking breaks on a specific day, and something on your side usually changed that day.
Is it an organic traffic drop or every channel?
In GA4, break sessions out by default channel group. If organic search fell and everything else held, you have an organic traffic drop and the rest of this post applies. If direct, paid, email and referral all fell by a similar share on the same day, the cause is tracking or a real fall in demand for the business, not SEO. No amount of title tag rewriting fixes a broken consent banner.
Step 2: Compare year over year, not month over month
Plenty of businesses have seasons, and a month-on-month chart turns every off season into a crisis. HVAC demand follows the weather, tutoring follows the school calendar, and gift shops go quiet after the holidays. Comparing this month to last month tells you about the calendar. Comparing it to the same month last year tells you about your site.
"Sometimes changes in user behavior will change the demand for certain queries..." Google Search Central, Debugging drops in Google Search traffic
That same guide suggests setting Search Console's date filter to the last 16 months and comparing the last three months year over year. Do that, then check your main query in Google Trends to see whether interest in the topic itself fell. If this year's dip lines up with last year's dip, it's the season, and the fix is patience (or a service that sells in the off season).
One month is a data point, not a trend. On a stationery store in Australia, April 2025 showed a real double-digit fall in users, clicks and sales against March, and May was back to roughly March's level. Had anyone rebuilt the site in April, the rebuild would have taken the credit for a recovery it didn't cause.
Step 3: Read Search Console by clicks, impressions and position
Google Search Console's Performance report shows three numbers that move differently depending on the cause. Clicks are people who came to your site from Google. Impressions count how often your pages appeared in results. Average position is where they appeared. Read the three together, because any one alone misleads.
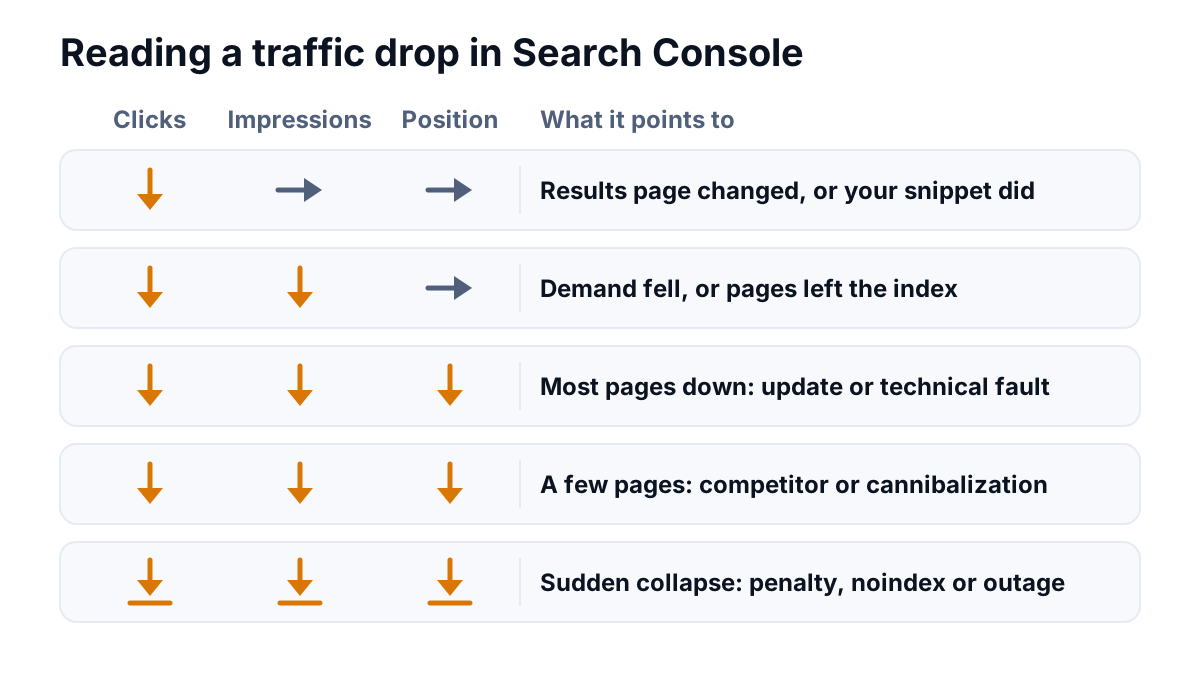
What the pattern tells you
| Clicks | Impressions | Position | Likely cause | Next check |
|---|---|---|---|---|
| Down | Steady | Steady | The results page changed, or your title and snippet did | Step 7 |
| Down | Down | Steady | Demand fell, or pages dropped out of the index | Step 2, then step 5 |
| Down | Down | Down on most pages | A site-wide cause: an update or a technical fault | Steps 5 and 6 |
| Down | Down | Down on a few pages | A page-level cause: a competitor, cannibalization or a changed page | Step 8 |
| Near zero overnight | Near zero | Gone | Manual action, noindex, robots.txt block or server outage | Steps 4 and 5 |
Which pages and queries dropped
Set the date filter to compare the four weeks after the drop with the four weeks before (or the same weeks last year, if you're seasonal), then open the Pages tab and sort by the click difference. A drop is rarely spread evenly. A handful of pages usually account for most of it, and those pages tell you where to look. Repeat on the Queries tab and split brand queries (searches for your business name) from the rest. If brand searches fell, fewer people are looking for you by name, and that's a marketing question, not an SEO one.
Check the Devices and Countries tabs too. A drop confined to mobile points at a mobile layout or speed problem. A drop in one country points at something local to that market.
Page-level views catch what the site-wide chart hides. On one HVAC account, 9 city pages split across 2 to 4 URLs each were the structural cause behind a month-on-month click drop of about 37%. That's cannibalization: several of your own URLs competing for the same search, which tends to leave none of them ranking well. A split like that is invisible on the site-wide chart and obvious on the page report. If you run city or service-area pages, the rules for location pages that don't compete with each other are worth reading.
Step 4: Check for manual actions and security issues
A manual action is a penalty applied by a person at Google rather than by an algorithm: a reviewer decided that pages on your site break Google's spam policies. You'll find it under Security and Manual Actions in Search Console, and Google's manual actions report documentation explains each type. If the report shows no issues, move on. If it lists an action, that's your cause, and the fix is to remove what broke the policy and file a reconsideration request.
The security issues report is in the same menu. Hacked sites lose traffic because Google warns searchers away, or because injected spam pages (sometimes thousands of junk URLs in another language) drag the whole site down. Search Google for site:yourdomain.com and look for pages you didn't create.
Step 5: Look for technical faults
Google can't rank a page it can't crawl or has been told to ignore. After a redesign, technical faults are the usual suspect, and they're the cheapest real cause to fix once found. The common ones:
- Noindex left on. A noindex tag tells Google not to show a page. Developers use it on staging sites (the test copy of a site), and it sometimes ships with the new one.
- robots.txt blocking. The robots.txt file tells crawlers which paths to stay out of. One wrong line blocks a whole folder, or the whole site.
- Broken or missing redirects. A 301 redirect sends an old URL, and the rankings it earned, to the new one. When URLs change without them, Google finds errors where your ranking pages used to be.
- Wrong canonicals. A canonical tag names the preferred version of a page. Pointing every page at the homepage, or at the staging domain, tells Google to drop them.
- Server errors and outages. Repeated 5xx errors (the server failing to respond) make Google slow its crawling and, if they persist, drop pages.
- Content that needs JavaScript to appear. If the text only shows after scripts run, and those scripts fail for Google, the page looks empty.
Where to look: the Pages report under Indexing lists why pages aren't indexed, with reasons such as "Excluded by 'noindex' tag", "Blocked by robots.txt" and "Server error (5xx)". Run URL Inspection on the three biggest losers from step 3 and read what Google saw. Crawl stats, under Settings, shows whether Google had trouble reaching your server. For the full picture of this layer, start with what technical SEO covers.
Step 6: Match the drop date against Google updates
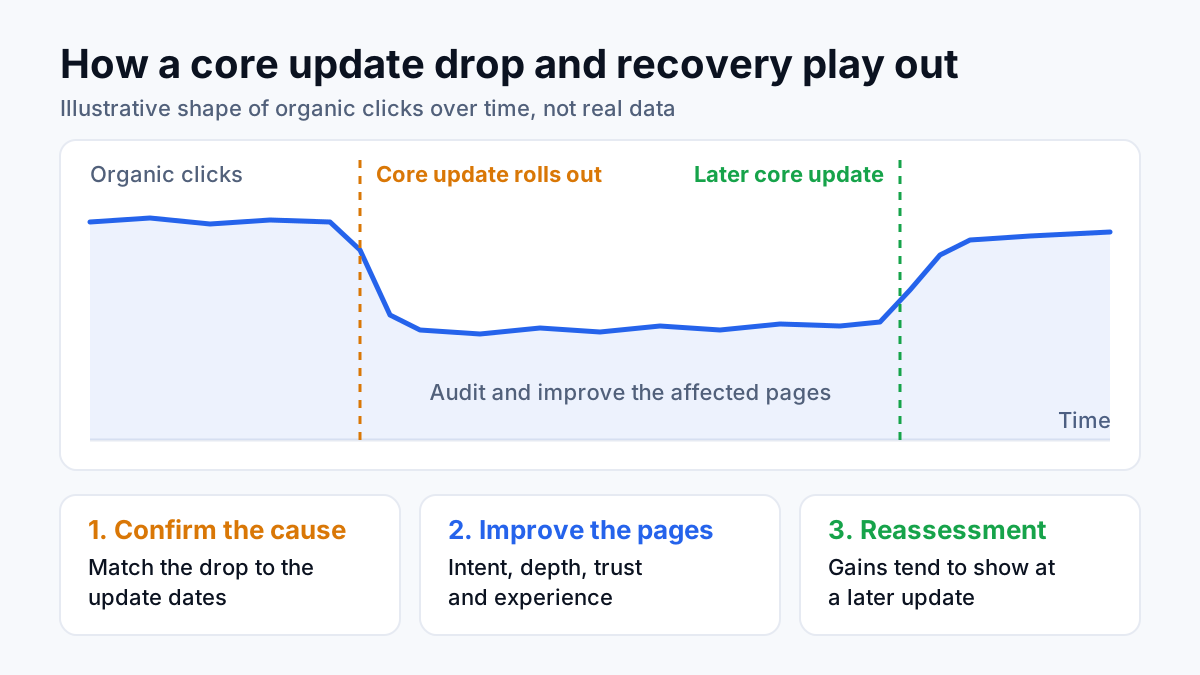
Google adjusts its ranking systems constantly and announces the larger changes, including core updates (broad changes to how it ranks sites, rolled out a few times a year), on its Search Status Dashboard. Put the day your drop started, from Search Console's daily view, next to the rollout dates. A site-wide position loss that begins inside a rollout window, with steps 1 to 5 clean, points at the update.
Two things change how you respond. An update drop reflects how Google now judges your content and the trust behind it, so it rarely traces back to one broken page. And changing things mid-rollout muddies the data, so wait until the rollout finishes, then compare. What these updates reward, and how recovery tends to work, is covered in Google core updates.
In the recovery work I do, the order after an update drop is fixed: prune weak pages (remove or merge them), strengthen who's behind the content (named authors, credentials, revision dates), then repair structure and internal links. Sometimes the honest answer is that the business model behind the pages is too thin to fix cosmetically, and it's better to hear that before paying for work that can't hold.
Step 7: Check whether the results page changed
Sometimes you hold your position and still lose the click. The SERP (search engine results page) now carries far more than ten blue links: AI Overviews (Google's generated summary at the top), ads, the map pack (the three local listings with a map), featured snippets, related question boxes, videos and product grids. Each one pushes the organic results further down the screen. The signature in Search Console is steady impressions and position with falling clicks, which means click-through rate (the share of people who saw you and clicked) fell.
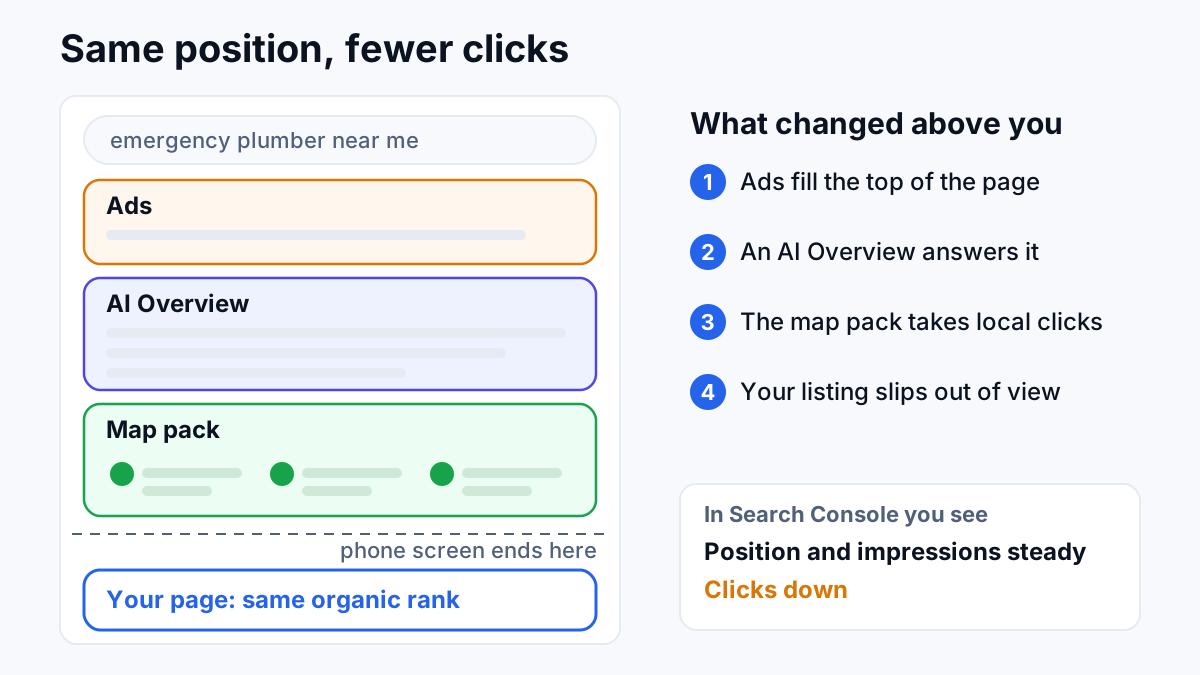
Search your lost queries in a private window, from the area your customers search from, and look at what now appears above you. For local businesses, clicks that used to reach an organic listing may move to the map pack, and the fix is ranking higher on Google Maps, not rewriting the page. For questions now answered by an AI Overview, the practical move is to be one of the sources it cites, and to put more weight on queries where people still need to click through.
Check your own titles too. If a template change rewrote them, or Google started showing a different snippet, click-through rate falls with no change in rank.
Step 8: Look at competitors last
Competitors come last because they're the most expensive answer. Responding means better pages, new content or links, which takes months rather than minutes. By the time you reach this step, you should have a short list of pages that lost position with no tracking fault, no season, no penalty, no technical fault and no update to blame.
For each page, search its main query and note who moved above you. Then ask three questions. Did they publish a page that answers the search more completely? Did a new kind of site enter the results, such as forums, marketplaces or directories? Did they earn links and mentions you don't have? The answer decides the work: improve the page, target the queries the newcomers don't serve, or close the authority gap.
Mistakes that make a traffic drop worse
- Changing everything at once. Rewrite titles, prune pages and redesign in the same week, and you'll never know which change helped or hurt.
- Deleting pages in bulk without a diagnosis. Pruning helps when weak pages drag the site down. Mass deletion as a guess removes pages that were earning clicks.
- Trusting third-party traffic estimates. SEO tools estimate traffic from rankings and search volumes. They're models. Search Console is measurement.
- Disavowing links in a panic. A disavow file tells Google to ignore certain backlinks. Used without evidence of a link problem, it throws away links that were helping.
- Reading a week of data. Daily numbers are noisy. Compare at least four weeks against the matching period before deciding anything.
What to do next
Write down the day the drop started, then run steps 1 to 3 yourself. They need nothing but GA4 and Search Console access, and they often settle the question: broken tracking, a seasonal dip, or a few pages that need attention.
If the evidence points at steps 5 or 6, or three people have given you three different theories, get a diagnosis before anyone touches the site. My traffic recovery work starts exactly there: the drop dated against Google's update timeline and your change history, the losing pages isolated, and one ordered plan instead of a list of possibilities.